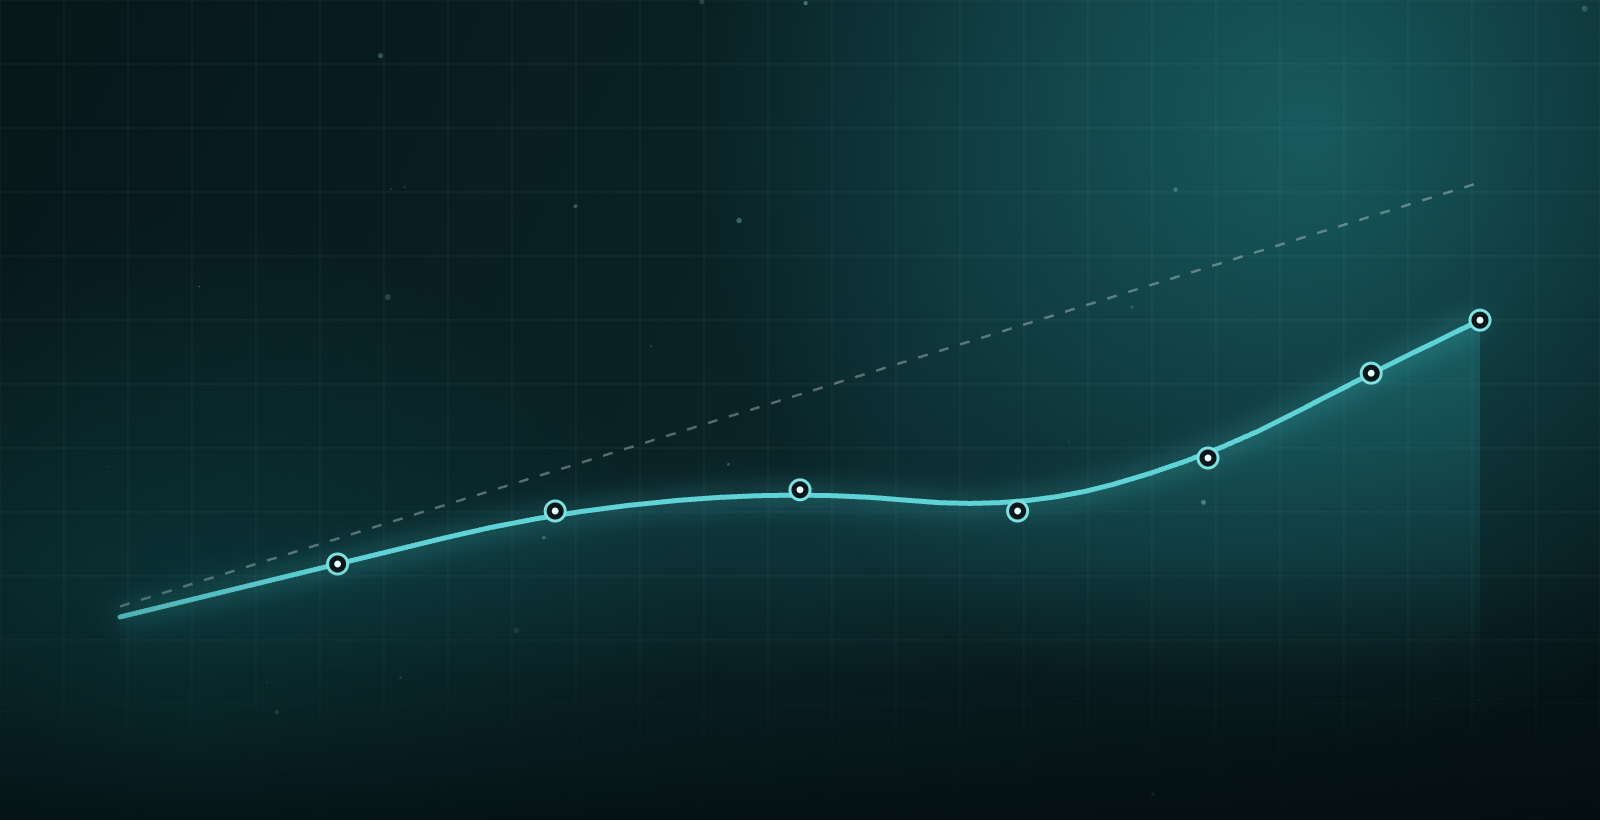
PhenoAge — short for phenotypic age — was published by Morgan Levine and colleagues in 2018. Instead of guessing your health from your birthday, it reads it from your blood. Nine standard lab values, weighted and combined with your chronological age, produce an estimate of how old your body actually behaves.
If your PhenoAge is lower than your chronological age, your biology is running younger than the calendar says. If it's higher, that's an early signal worth paying attention to — often years before a standard "normal/abnormal" flag would ever trip.
The nine markers — and what each one reflects
Each marker is a window into a different system. None is decisive alone; PhenoAge is a weighted composite, so a single high value rarely swings the result on its own. Here's what they capture and which direction tends to age you.
Plus your chronological age, which anchors the estimate. Directions above describe the typical contribution within normal physiological ranges — clinical context always matters.
Which markers move it most?
Three tend to do the heavy lifting for most people: CRP, RDW, and fasting glucose. Inflammation, red-cell instability, and blood-sugar control each track closely with how the body ages — and, helpfully, all three respond to things you can influence.
"The value of PhenoAge isn't the number itself — it's watching the number bend as you change what you can."
What tends to lower it
PhenoAge is responsive — it can shift meaningfully between blood draws. The levers that show up most often:
- Bringing down chronic inflammation (CRP) — through sleep, activity, and resolving hidden sources of inflammation.
- Improving fasting glucose and insulin sensitivity via nutrition and regular movement.
- Correcting nutrient deficiencies that show up in RDW and MCV, such as iron, B12, or folate.
- Supporting liver and kidney function, which surface through ALP, albumin, and creatinine.
See your own number
The best way to understand PhenoAge is to run your own labs through it. Our free calculator does the full Levine computation in your browser — nothing is uploaded — and Verith for iPhone tracks the number over time as new results come in.